Scan your watchlist, explore a chart, or keep prices in the background while modeling. Start here, then explore each feature.
Blender 4.5 LTS / 5.x8 UI languagesBring your history JSON
In this guide01
Your first chart
Try the bundled synthetic data first. Adding a symbol alone does not retrieve its prices.
This add-on displays price histories inside Blender; it does not place trades. Install the release ZIP using Preferences → Get Extensions → Install from Disk, then enable it. The same ZIP supports Blender 4.5 LTS and Blender 5.x.
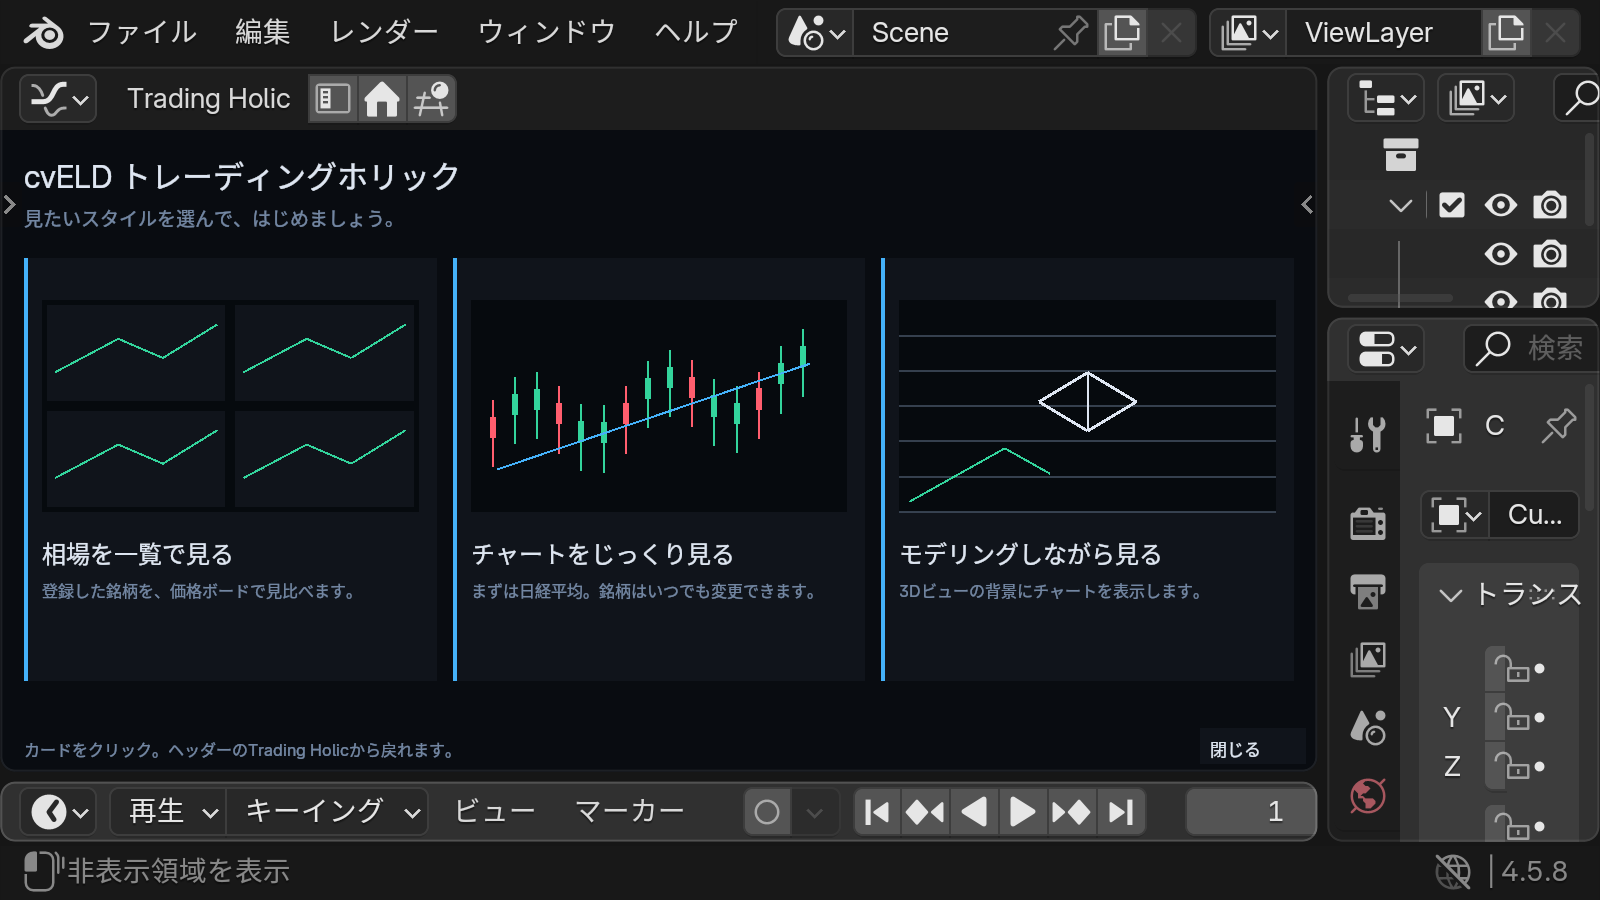
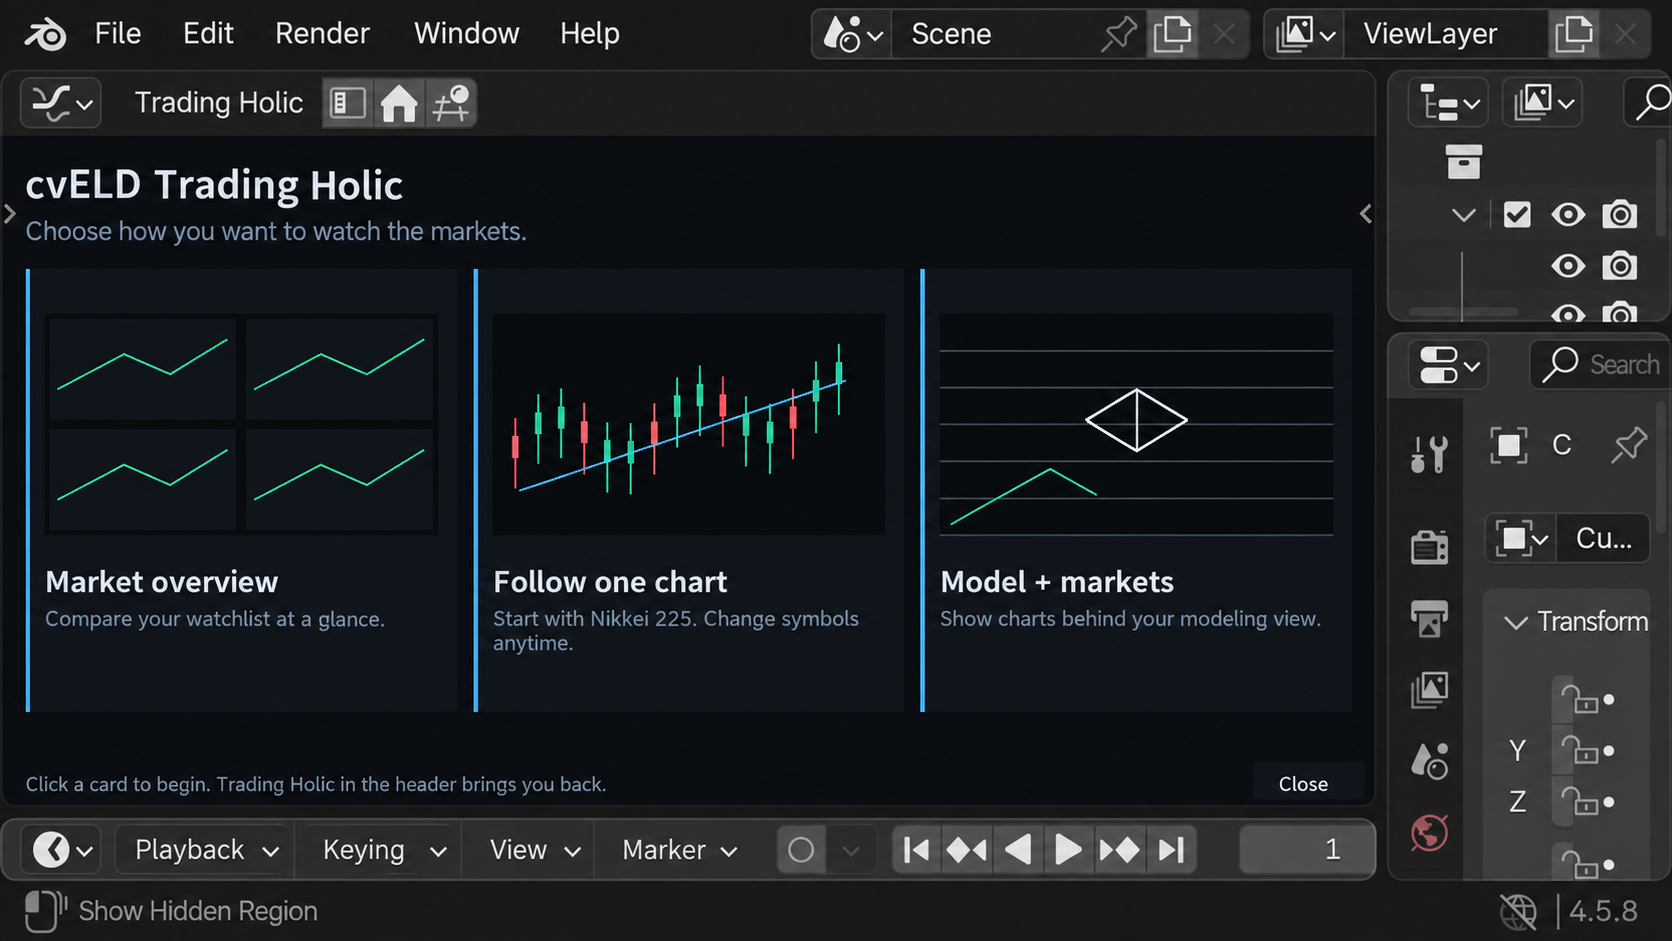
Choose cvELD Trading Holic from the editor selector, or open it through Trading Holic in a 3D View header. The sidebar category is cvELD Trading Holic. The welcome screen provides routes to the board and charts.
For a first result, add examples/watchlist.json using Edit watchlist → Import JSON, then use Import price history JSON for examples/synthetic_history.json. Select DEMO. These are invented prices; your own symbols require history data you have rights to use.
English-localized image edit of a Blender 4.5.8 capture. Illustrative UI; synthetic data.
Updating and uninstalling
Export your watchlist before updating. For a full backup, keep watchlist.json and watchlist_quotes.json from CONFIG/cvELD_TradingHolic together. Install and enable the updated ZIP. To uninstall, disable and remove the extension in Blender Preferences. Keep your backup separately.
02
Price data and availability
Import local OHLCV JSON for stocks, indices, FX and crypto. Registering a symbol does not download its prices. Yahoo price collection, complete exchange-directory downloads and embedded news headlines are disabled. Automated Rakuten turnover rankings are not implemented.
Update and automatic-refresh controls do not imply a live stock-price feed. The only enabled online data source is attributed Alternative.me crypto Fear & Greed. VIX requires licensed local history. Existing caches are retained; check timestamps and stale/error indicators.
Market clocks and SQ use bundled calendars. They do not monitor emergency closures, trading halts or brokerage connection status.
03
Board, chart and combined mode
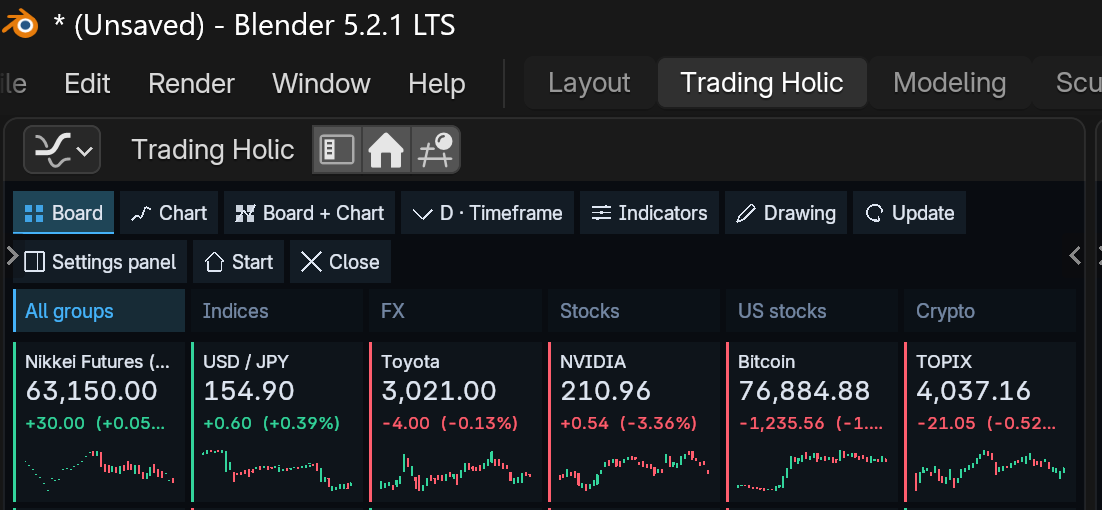
Board fills available space with registered tiles. All groups interleaves each group's first entry, then its second, and so on. Scroll for remaining entries. Starters contain ten symbols in each of five groups, fifty total; this is not an automatically ranked universe.
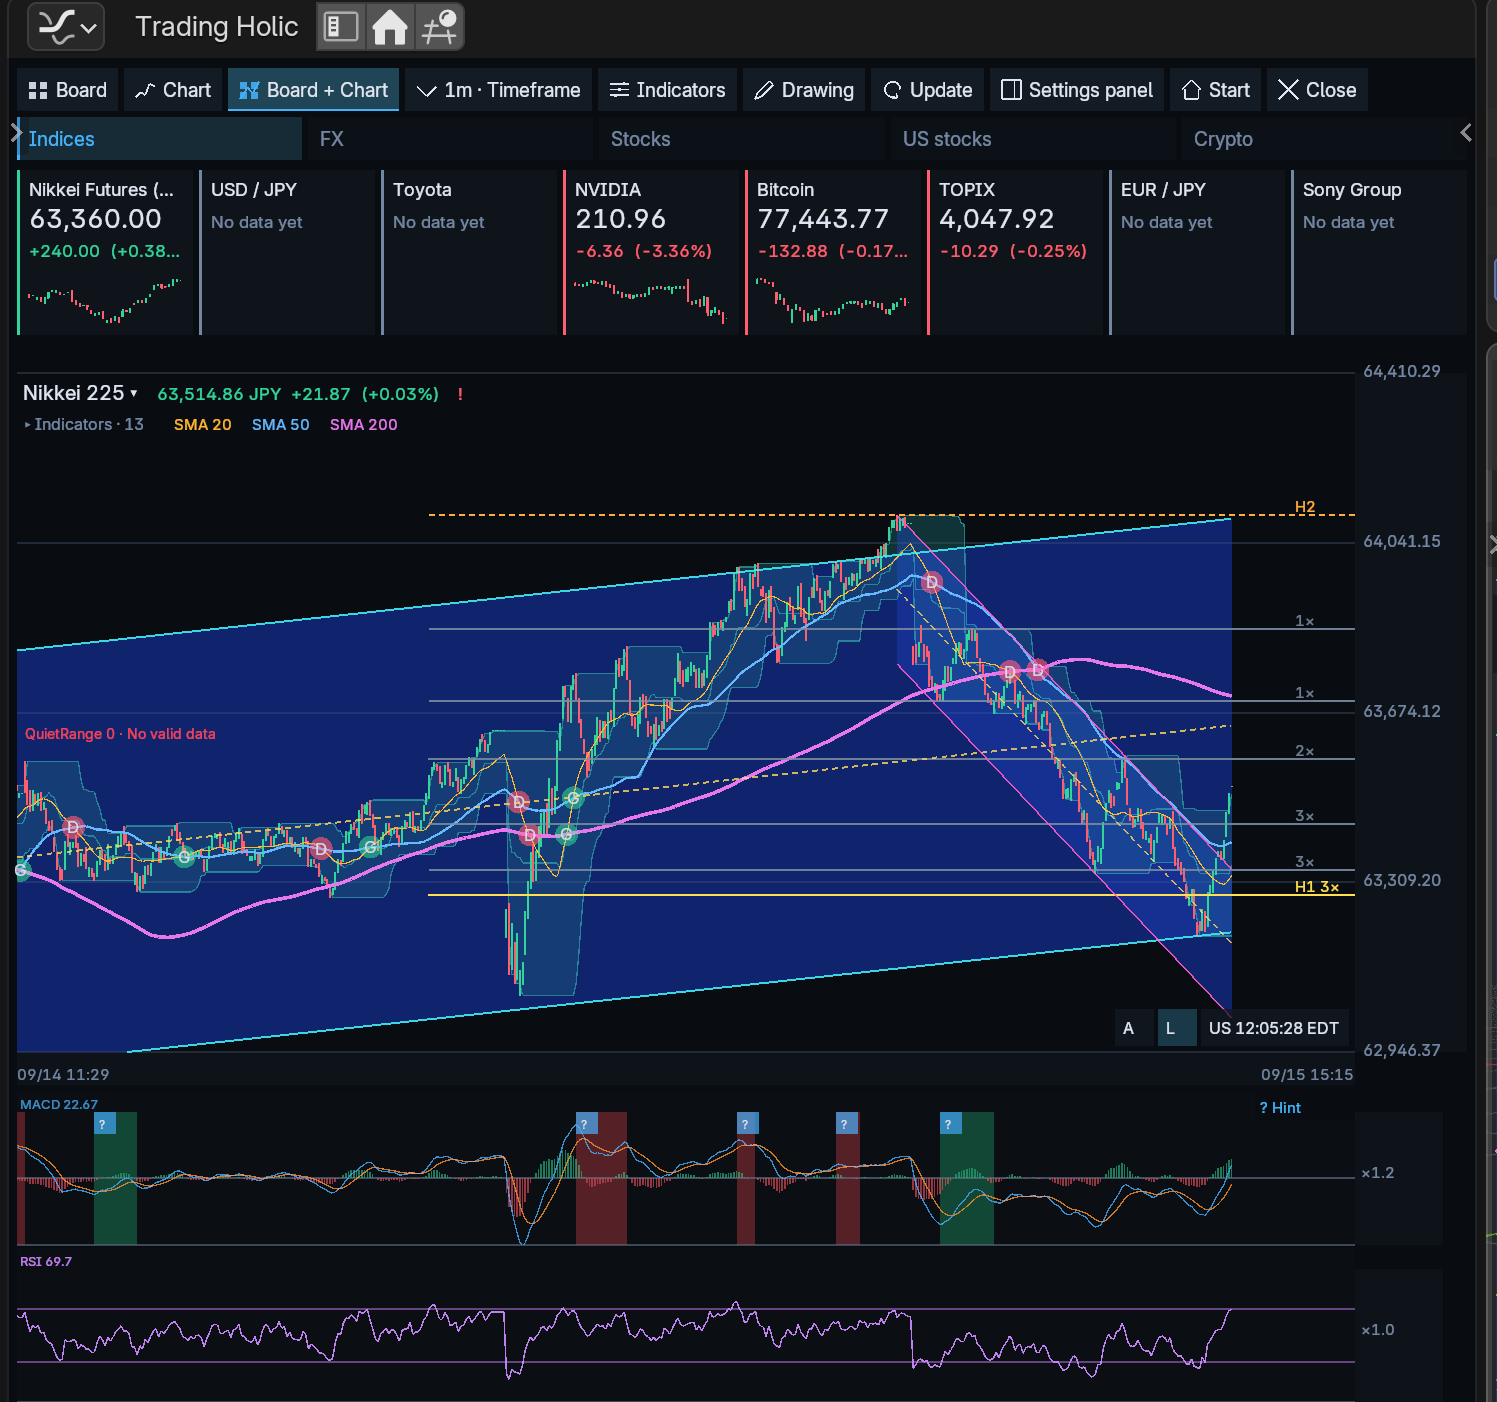
Chart enlarges the selected instrument. Board + Chart combines up to eight cards with a detail chart; card selection updates that chart without leaving the mode. Each editor pane retains its own symbol, timeframe, display mode and indicator settings.
Short views condense the toolbar into View / Actions. Symbol, price and indicator controls overlay the chart to save height. Close or Esc restores the previous editor.
Board: switch groups to compare symbols. User-provided screenshot, English UI. Prices, missing data and warnings reflect the captured state.Board + Chart: watchlist cards and the detailed chart share one pane. User-provided screenshot, English UI. Prices, missing data and warnings reflect the captured state.04
Names, codes and JSON
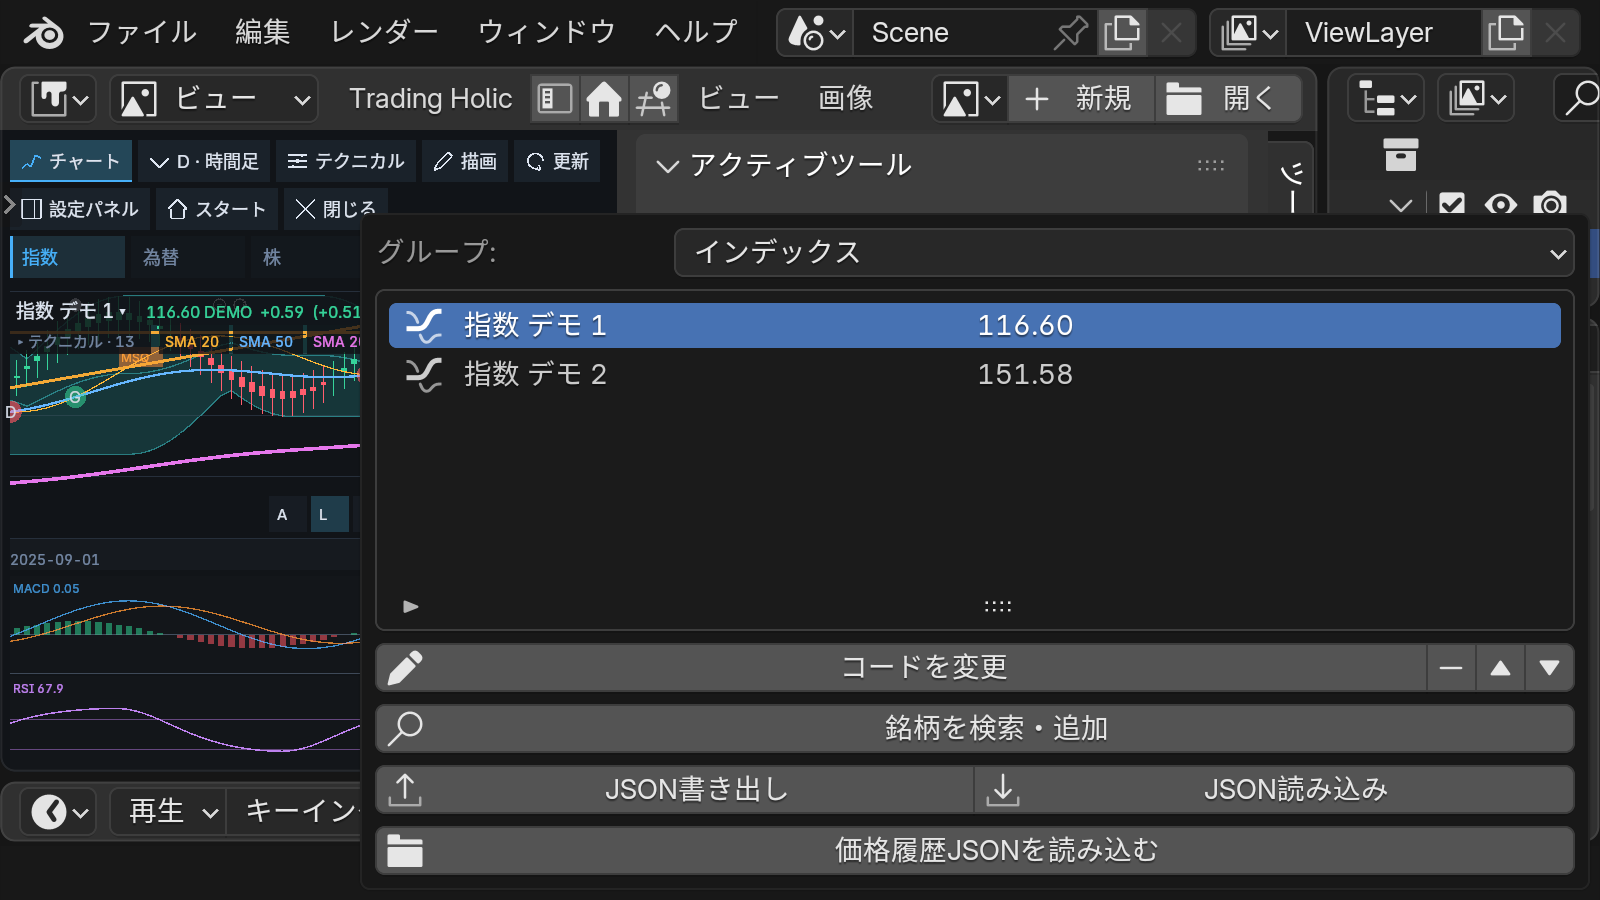
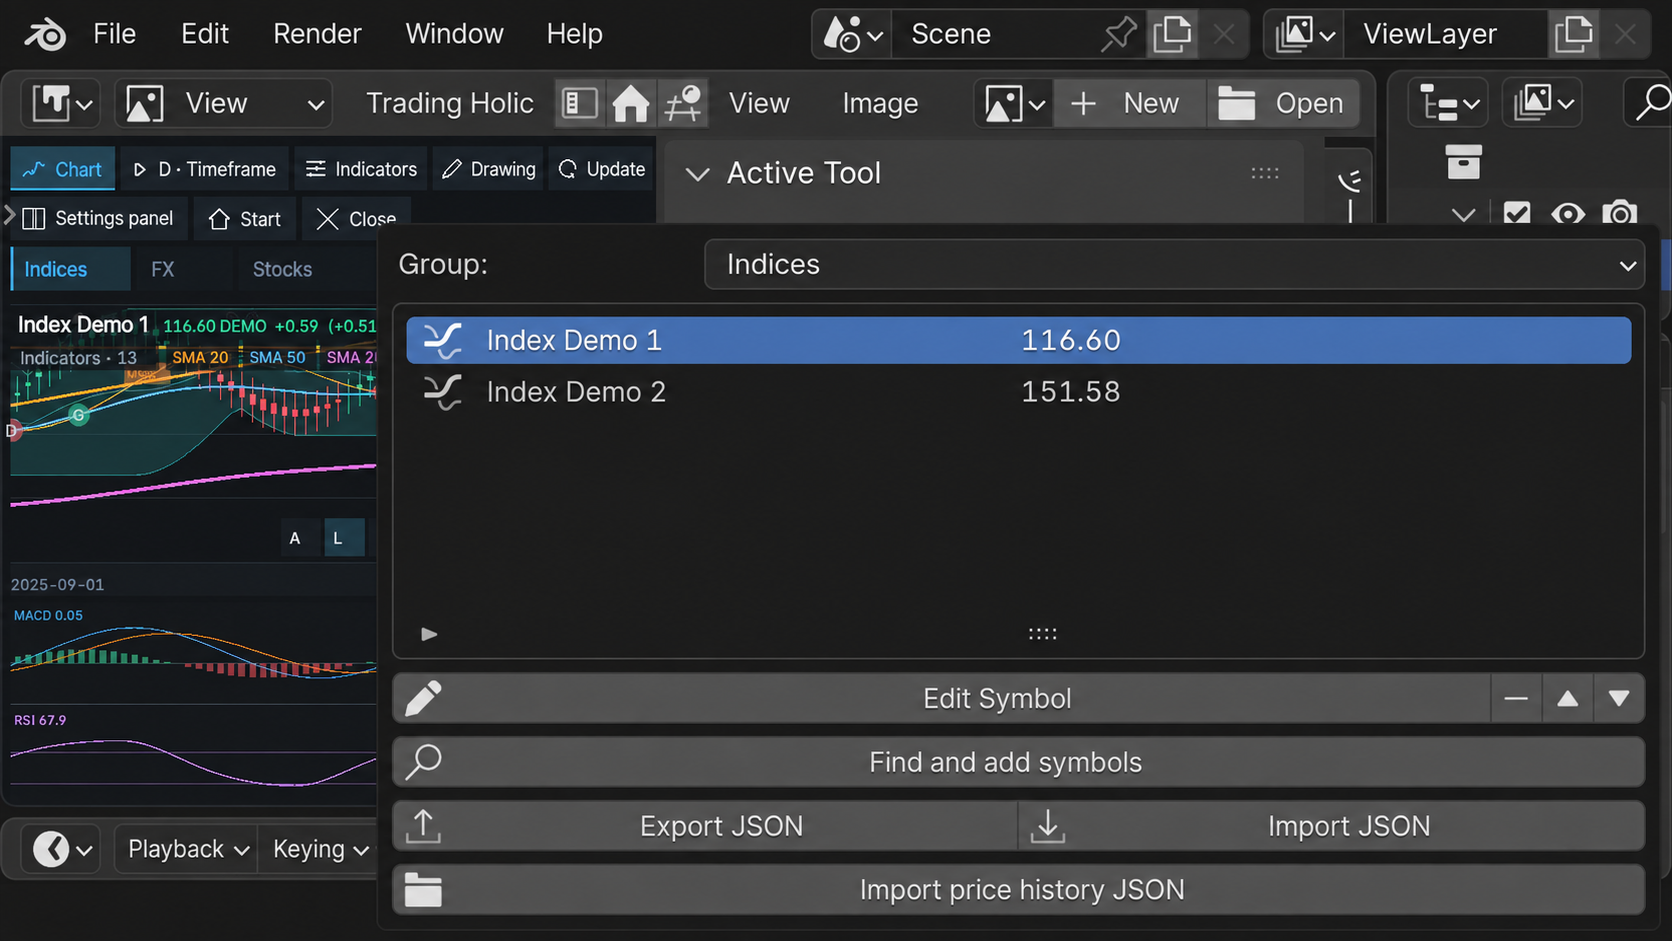
Enter a code or name such as 7203, Toyota, Bitcoin or BTC-USD. A display label is optional. Use search for ambiguous matches. Search covers selected starters and registered symbols, not every listed security. Edit watchlist controls order, groups, additions and removal, up to 100 entries.
Export JSON saves codes, labels and order for all groups, excluding price history and personal settings. Import JSON adds new entries or replaces the entire list. Invalid formats, duplicates and over-limit files are rejected before changes. Chart ink is preserved.
For a full manual backup keep both watchlist.json and watchlist_quotes.json in Blender's CONFIG/cvELD_TradingHolic directory. Blender 4.5 and 5.x use separate settings directories; portable JSON transfers watchlists between them.
English-localized image edit of a Blender 4.5.8 capture. Illustrative UI; synthetic data.05
History JSON format
Top-level fields are format: cvELD.TradingHolic.history, version: 1 and a quotes array. Each history has code, timeframe and bars. A bar contains Unix-seconds t, positive o/h/l/c (open/high/low/close), and volume v or null. Optional end is the closing Unix time; closed indicates confirmation. Name, currency, source and mintick are optional.
Times must increase; prices must be finite and positive; volume must be nonnegative or null. Limits are 2–1200 bars per history, 100 histories and 16 MB. Successful imports recompute indicators and evaluate enabled alerts. Indicators needing more bars remain unavailable.
Timeframes are 1m / 5m / 15m / 30m / 1h / 4h / 1d / 1wk / 1mo. Supply history for the selected timeframe. Daily bars are not turned into invented minute candles.
06
Navigation, A/L and clocks
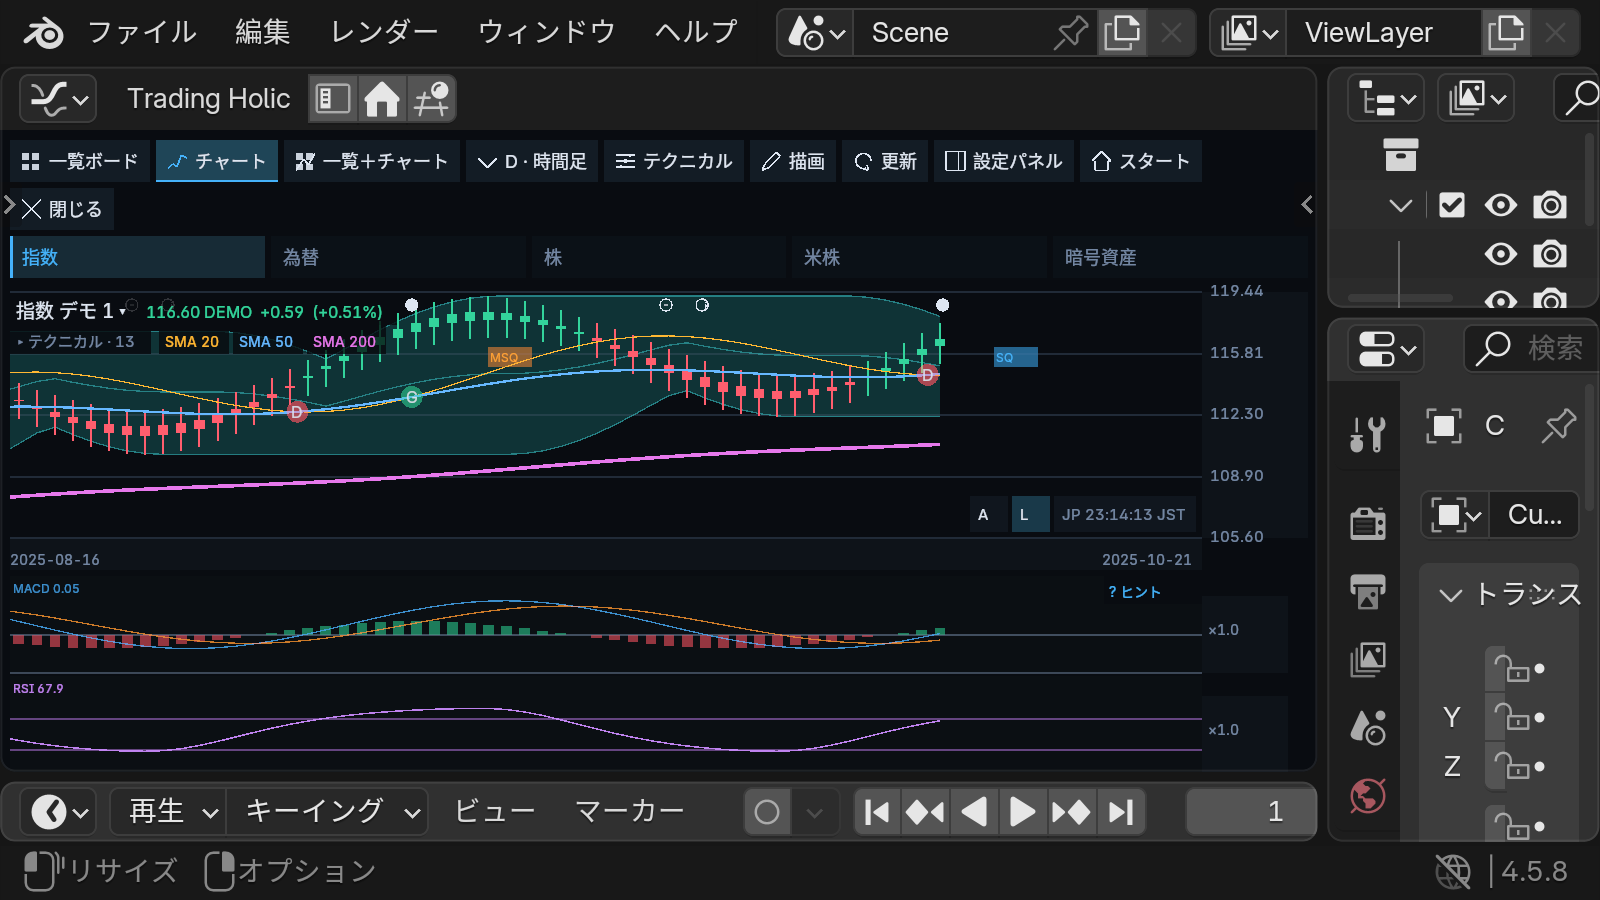
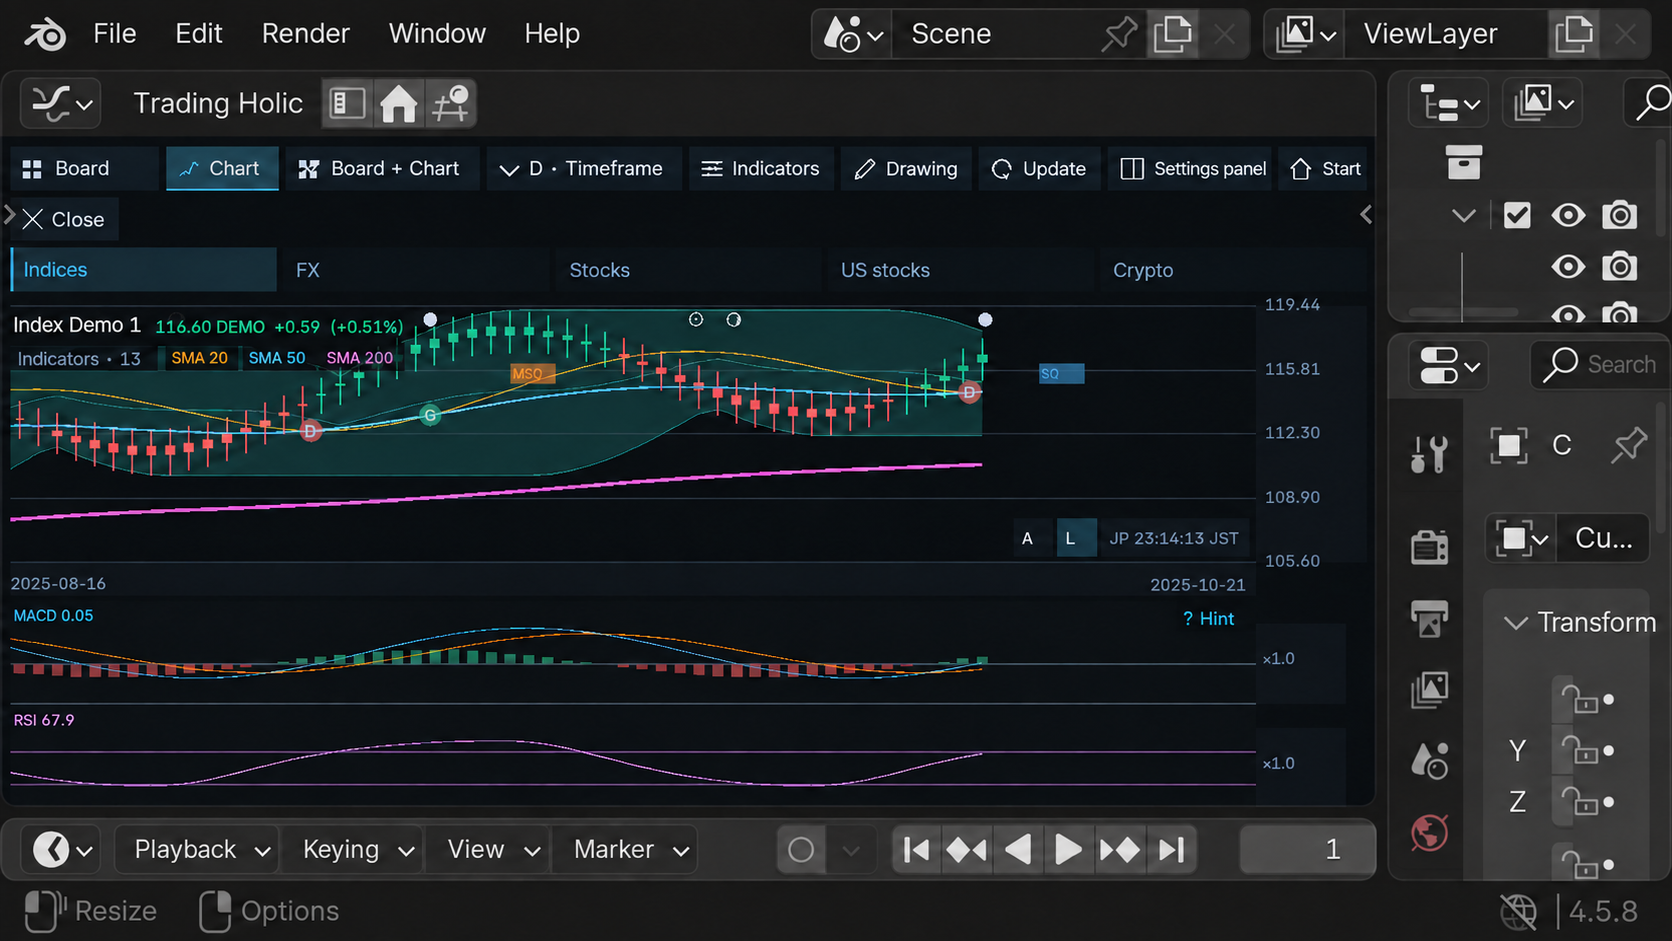
Drag inside a chart to pan horizontally and vertically. The wheel changes the visible period. Drag the right price axis vertically to scale prices; drag the bottom date axis horizontally to scale time. Space can be left after the final candle.
A fits prices to the visible range; L selects logarithmic display. Price-axis manipulation disables Auto. Double-click axes to reset; Esc cancels an active drag. Oscillators share the horizontal timeline while retaining separate vertical scales.
Click the clock to switch JP/US and inspect session hours. Open sessions are bright, closed sessions dim. TSE cash sessions are 09:00–11:30 and 12:30–15:30 JST; NYSE core hours are normally 09:30–16:00 ET. These are not futures, FX or crypto opening indicators.
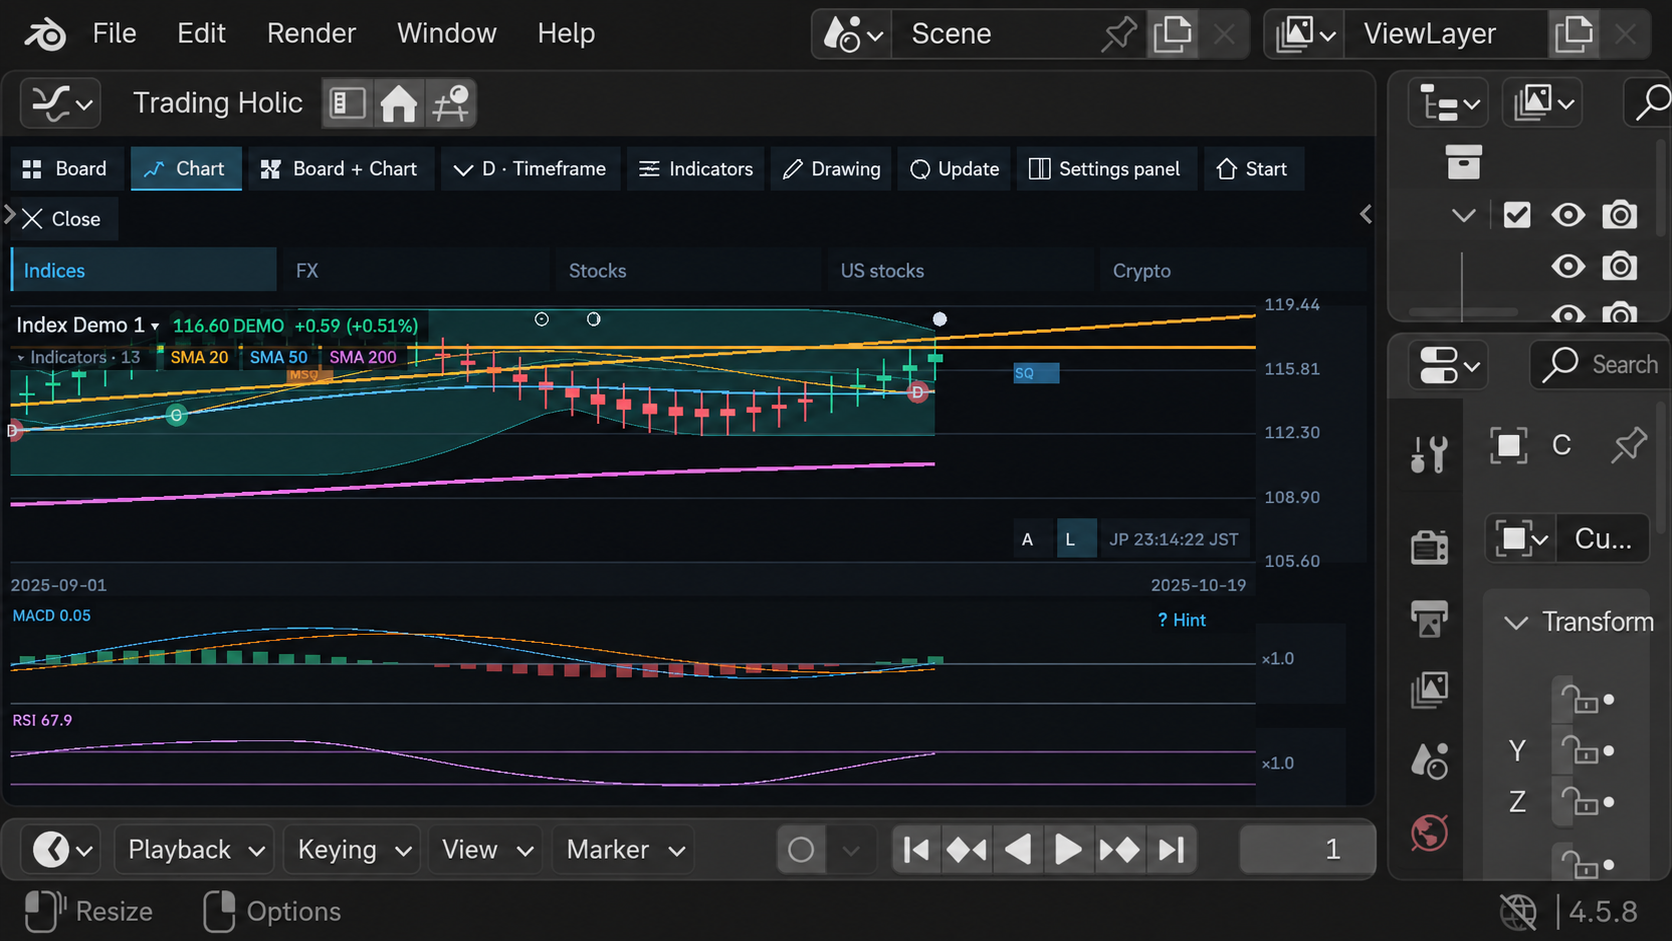
English-localized image edit of a Blender 4.5.8 capture. Illustrative UI; synthetic data.07
Indicator list and studies
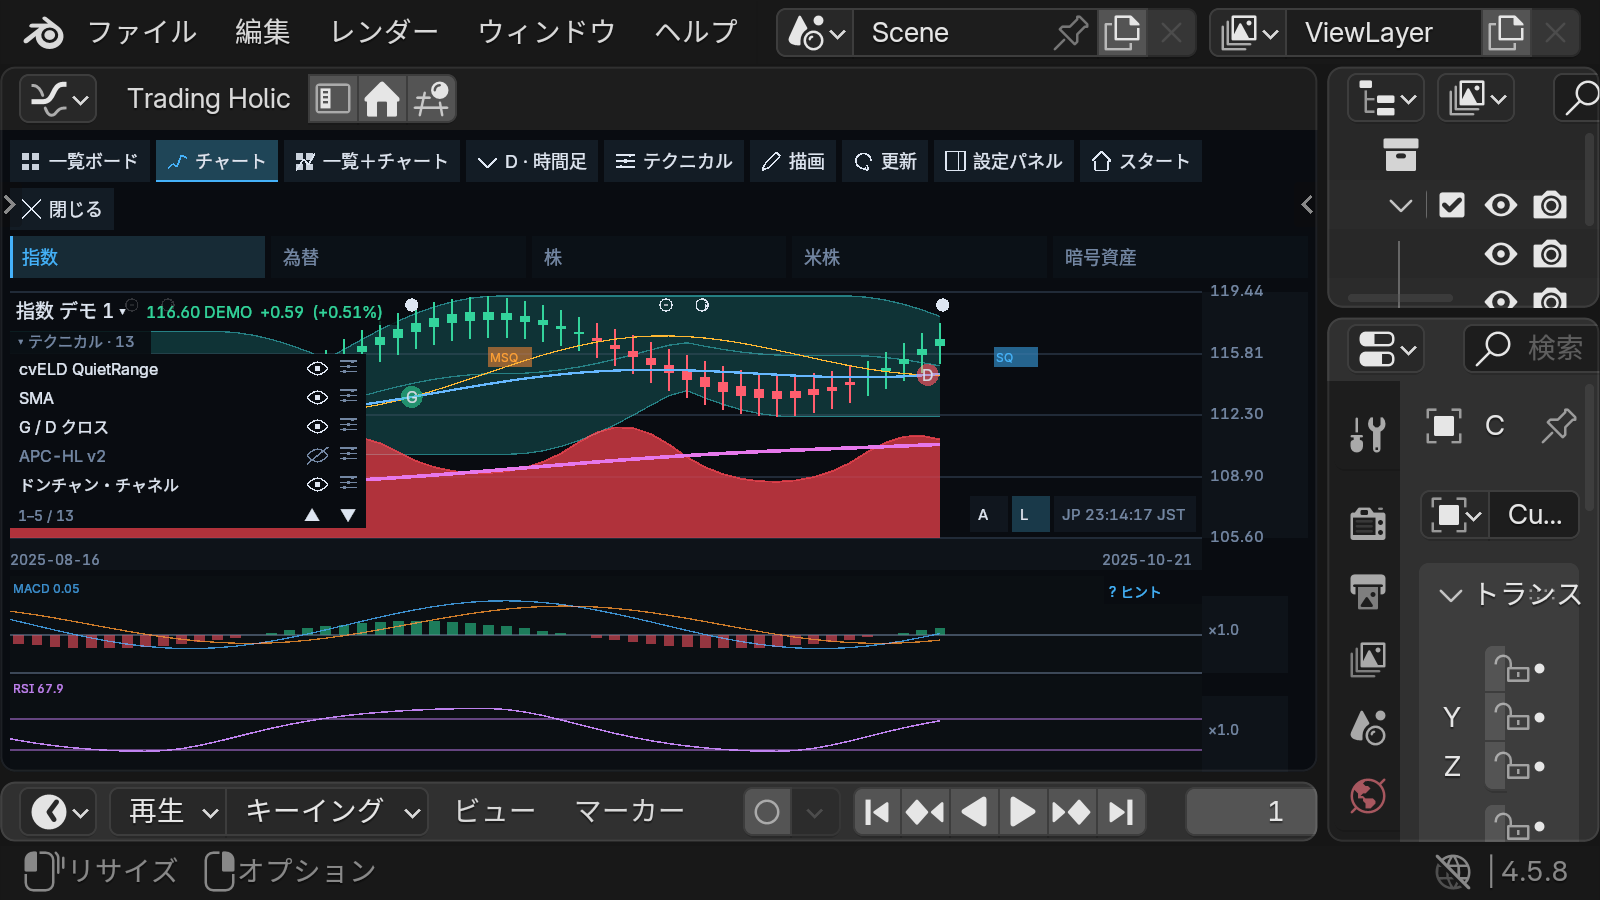
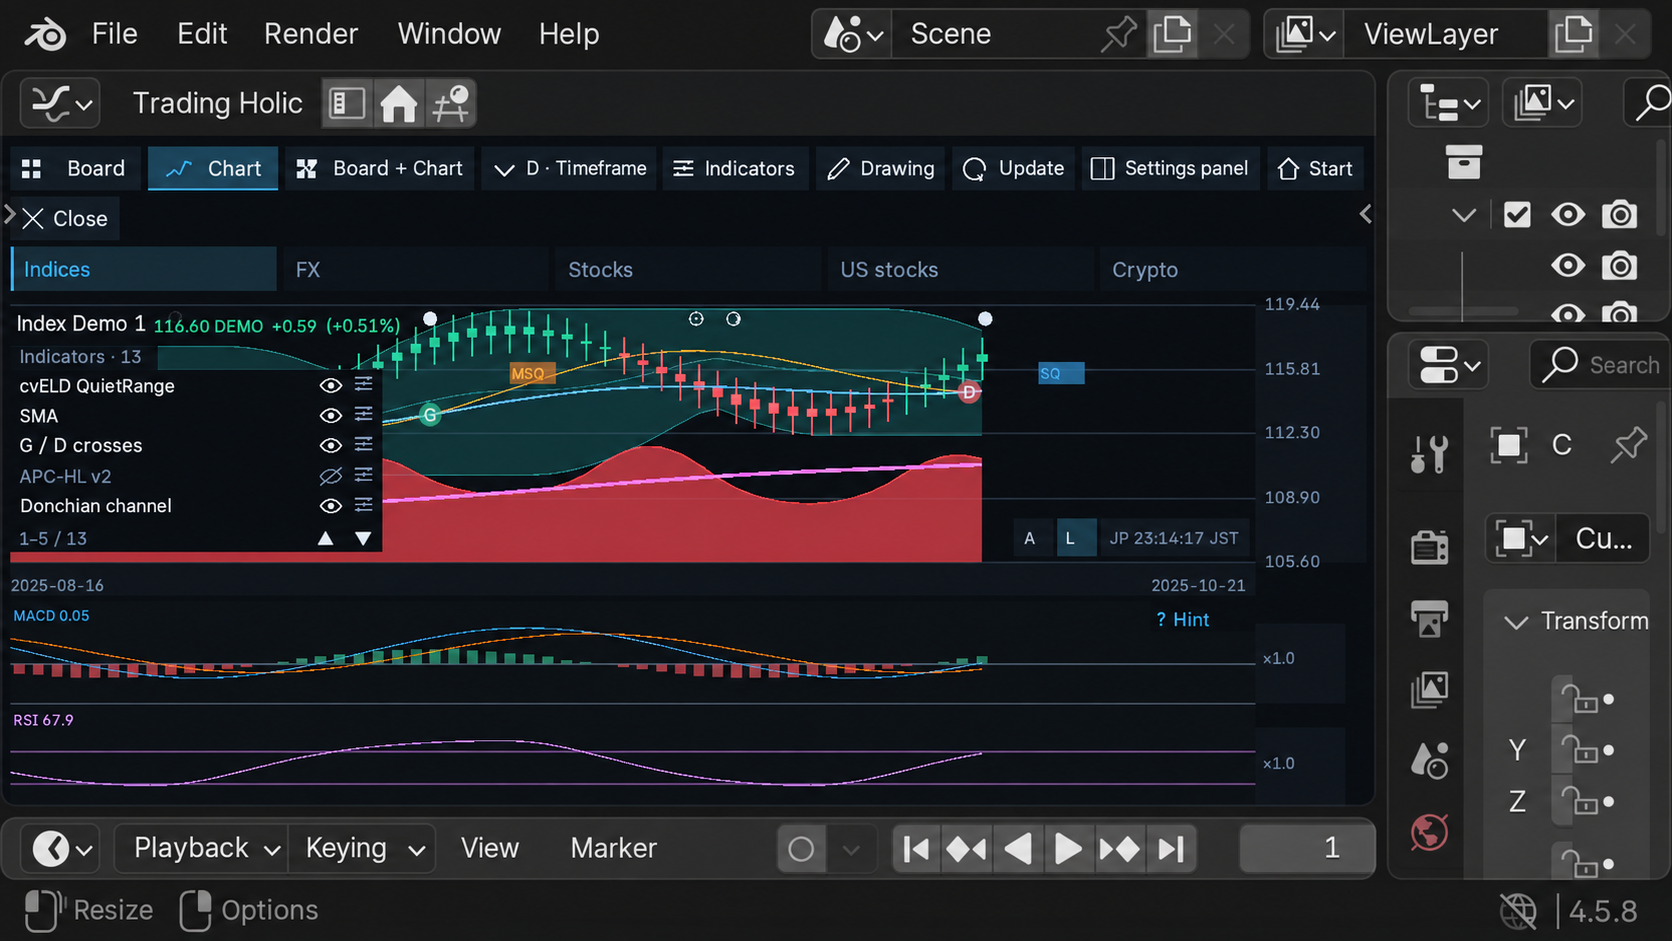
Expand Indicators below the symbol. The eye toggles visibility; the name or settings icon opens adjustments. Scroll over the list or use ▲▼. Expansion and visibility are per pane.
SMA presets are 20/50/200, 24/120/200, 24/168 and cash-equity 20/50/200. Longer averages are thicker. Click G/D for the crossed periods and explanation. APC-HL provides independently toggled horizontal levels and rising/falling parallel channels. Its supplied Pine source is ported to Python.
Switch price bands between Donchian (20 preceding highs/lows, excluding the current bar) and Bollinger (20-bar SMA ±2 population standard deviations). Periods and opacity are configurable.
MACD defaults to 12/26/9; RSI to 14 bars. MACD ? hints describe state and detected divergence. Some detections require later bars for confirmation and do not guarantee future price direction. Volume can be shown by time or price; the price profile approximates OHLCV distribution and is not tick-level traded volume.
English-localized image edit of a Blender 4.5.8 capture. Illustrative UI; synthetic data.08
cvELD QuietRange
QuietRange draws range-compression response peaks behind price candles. Defaults raise the inverse six-eligible-bar mean range to power four. Closed responses are red; developing responses green. It does not predict direction and does not alter price-axis Auto fitting.
Calculation / Source / Display / Alerts configure lengths, range floor, tick correction, volume weighting, session exclusions, gain, opacity, height, response MA, colors and markers. Sound alerts default OFF. New confirmed onset/settled events are checked on price updates; initialization does not replay historical alerts.
Source timeframes must match or exceed the chart. Other-symbol or higher-timeframe calculations reference the preceding confirmed source bar. Import the required histories first. Lower timeframes are rejected. Estimated tick sizes and approximate sessions can differ from feed-specific Pine states.
09
Study arrangement and calendar
MACD, RSI, time volume and fear can overlay together, use separate rows or share manually assigned row numbers. Each uses its own scale; height and opacity are adjustable. Fear switches between VIX and crypto Fear & Greed. F&G is daily; values are omitted when its adjacent attribution cannot fit.
Full/new/crescent moon, Mercury retrograde and SQ/MSQ markers can be shown. Calendar settings independently place moon, Mercury and SQ on the price chart or oscillator area; without an oscillator they fall back to price.
Click SQ/MSQ for date and the 09:00 JST calculation-start explanation. This does not predict final SQ publication time. News opens a related browser search instead of fetching headlines. Bundled market-calendar coverage is Japan 2020–2027 and USA 2026–2028; unsupported dates or missing data remain unknown. Celestial markers make no claim of trading effectiveness.
10
Chart ink and alerts
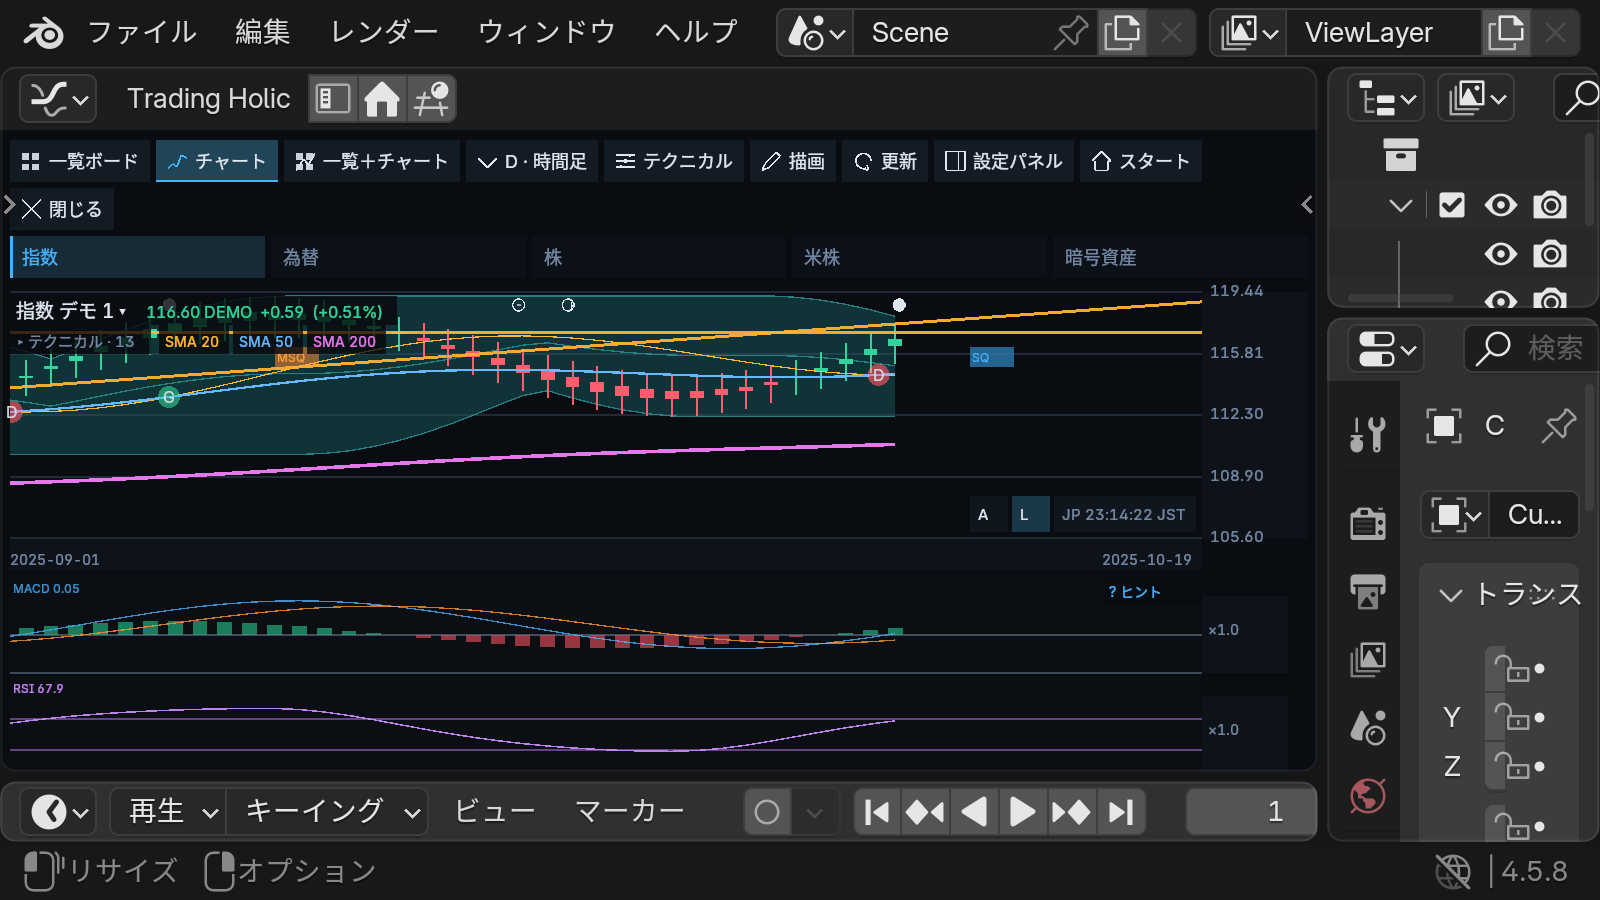
Drawing offers pen, horizontal, trend and parallel lines. Pen strokes are chart-specific ink, not Blender Grease Pencil objects. Points use time/price coordinates and follow zooming and panning.
Right-click a line for color, width, extension, touch alerts and tolerance. Choose Bell / Chime / Pulse. Alerts evaluate incoming price updates; this is not continuous real-time monitoring.
Ctrl+Z undoes ink; Ctrl+Shift+Z or Ctrl+Y redoes it. Menu actions are also available. History is per pane, fifty operations until reload. Clear drawings in this chart affects only the current symbol/pane and is undoable. Return to Pan chart for navigation.
English-localized image edit of a Blender 4.5.8 capture. Illustrative UI; synthetic data.11
Background charts while modeling
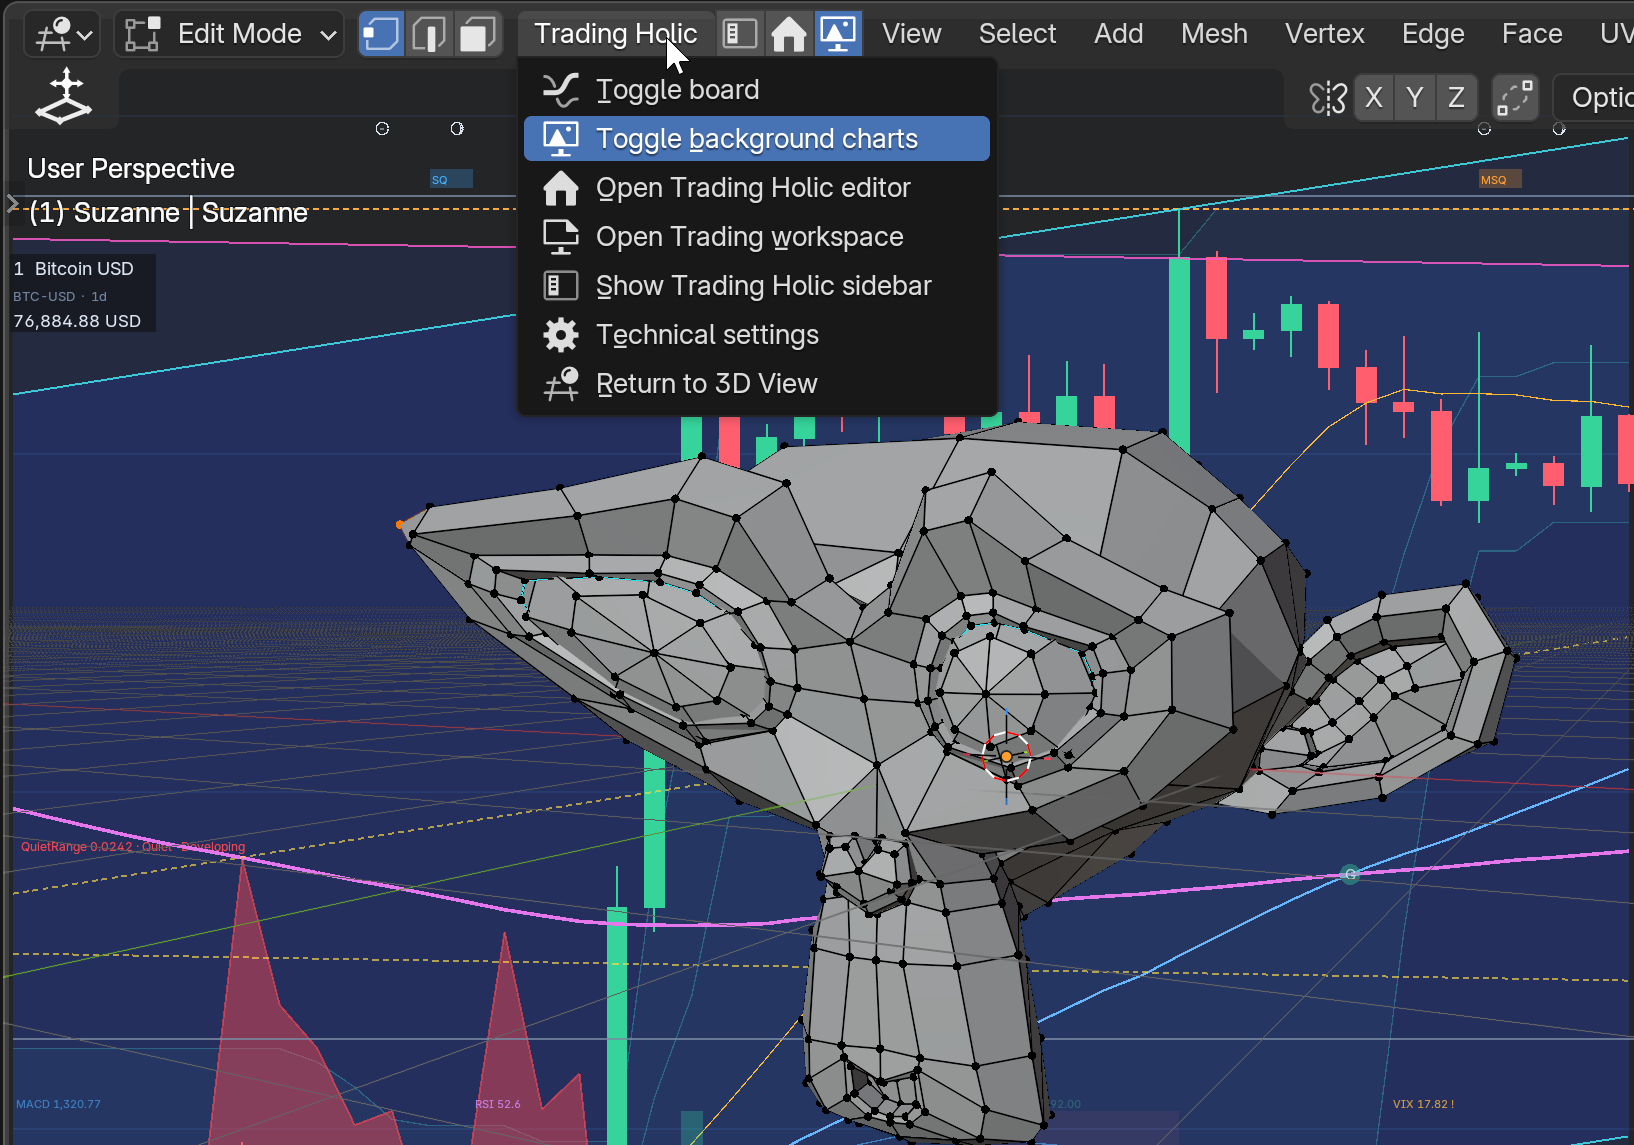
Toggle background charts from the 3D View Trading Holic menu or sidebar. Display one to four symbols using tile, row, column or focus arrangements. Picker buttons select registered symbols.
Adjust horizontal/vertical position, width/height, scale, opacity, visible bars and technical visibility. Background charts are read-only and leave modeling interaction available. Charts within one background view share that view's study settings.
Only chart text moves to avoid Blender's standard view information/statistics. Extra top spacing moves it further; custom text from other add-ons cannot be detected automatically. Color handling does not change scene exposure. Workspace + → Trading Holic also creates a multi-editor arrangement.
Use the Trading Holic menu to toggle backgrounds or open the workspace and sidebar. User-provided screenshot, English UI. Prices, missing data and warnings reflect the captured state.12
Change the UI language
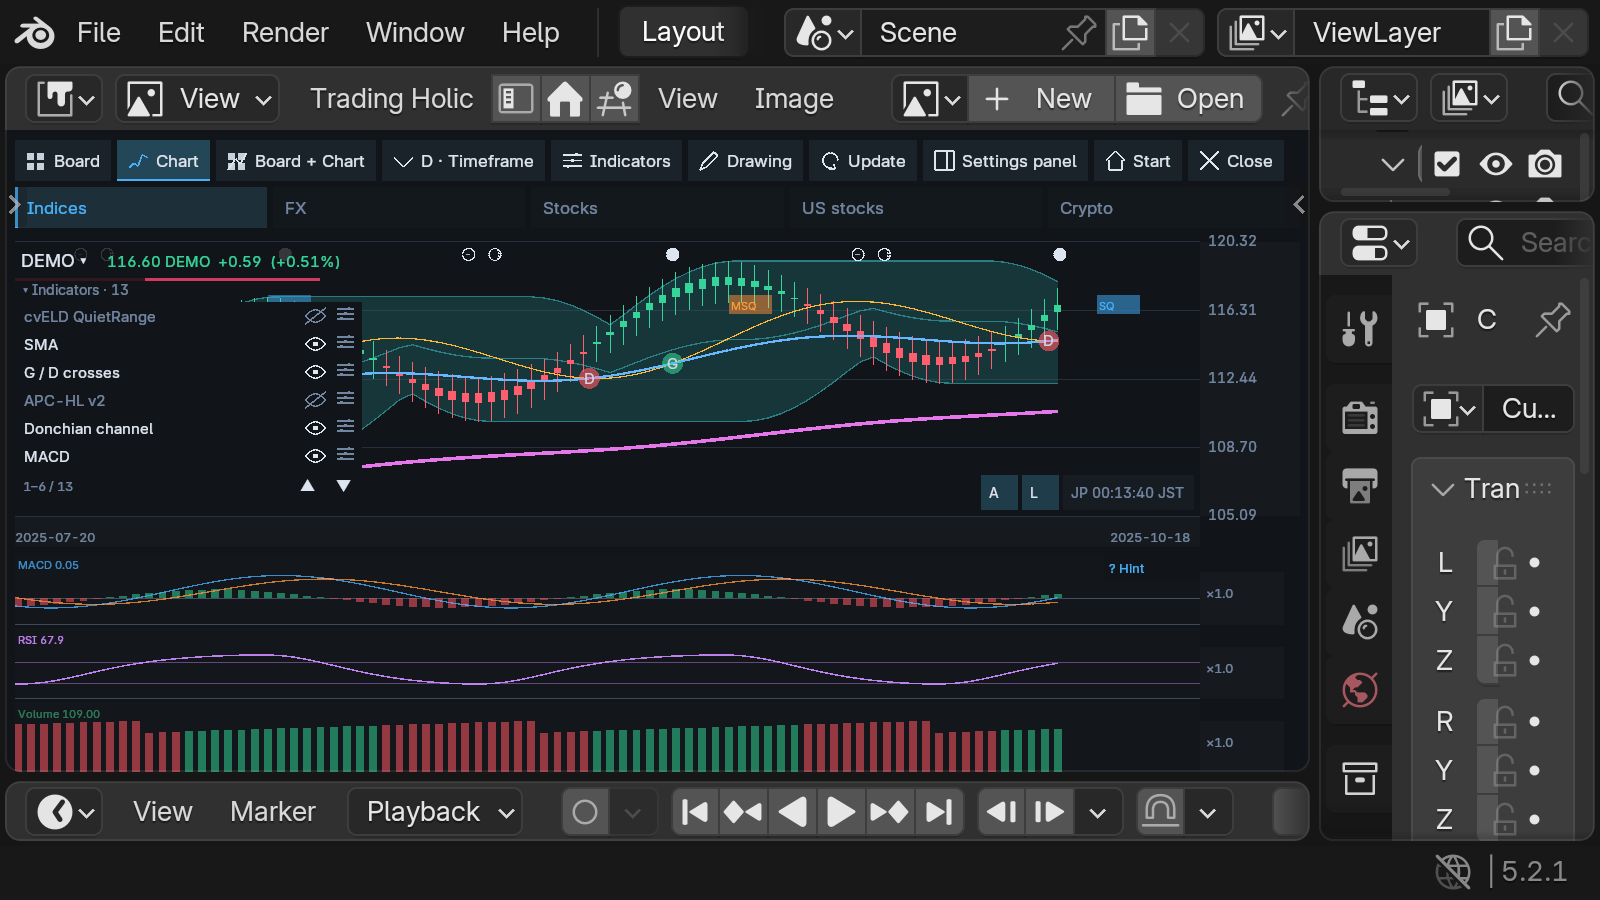
Select a language in Blender Preferences → Interface → Translation and enable Interface. Eight languages: English, Japanese, Chinese (Simplified/Traditional), Korean, Spanish, German, French and Brazilian Portuguese, in nine locale variants.
Since 1.15.0, native panels, custom charts and background charts follow the same interface language. Tooltips use a separate Blender option. Edit translations/translation.csv and reload the add-on to apply changes. Symbol codes and user names are preserved. Manuals and videos are separate materials.
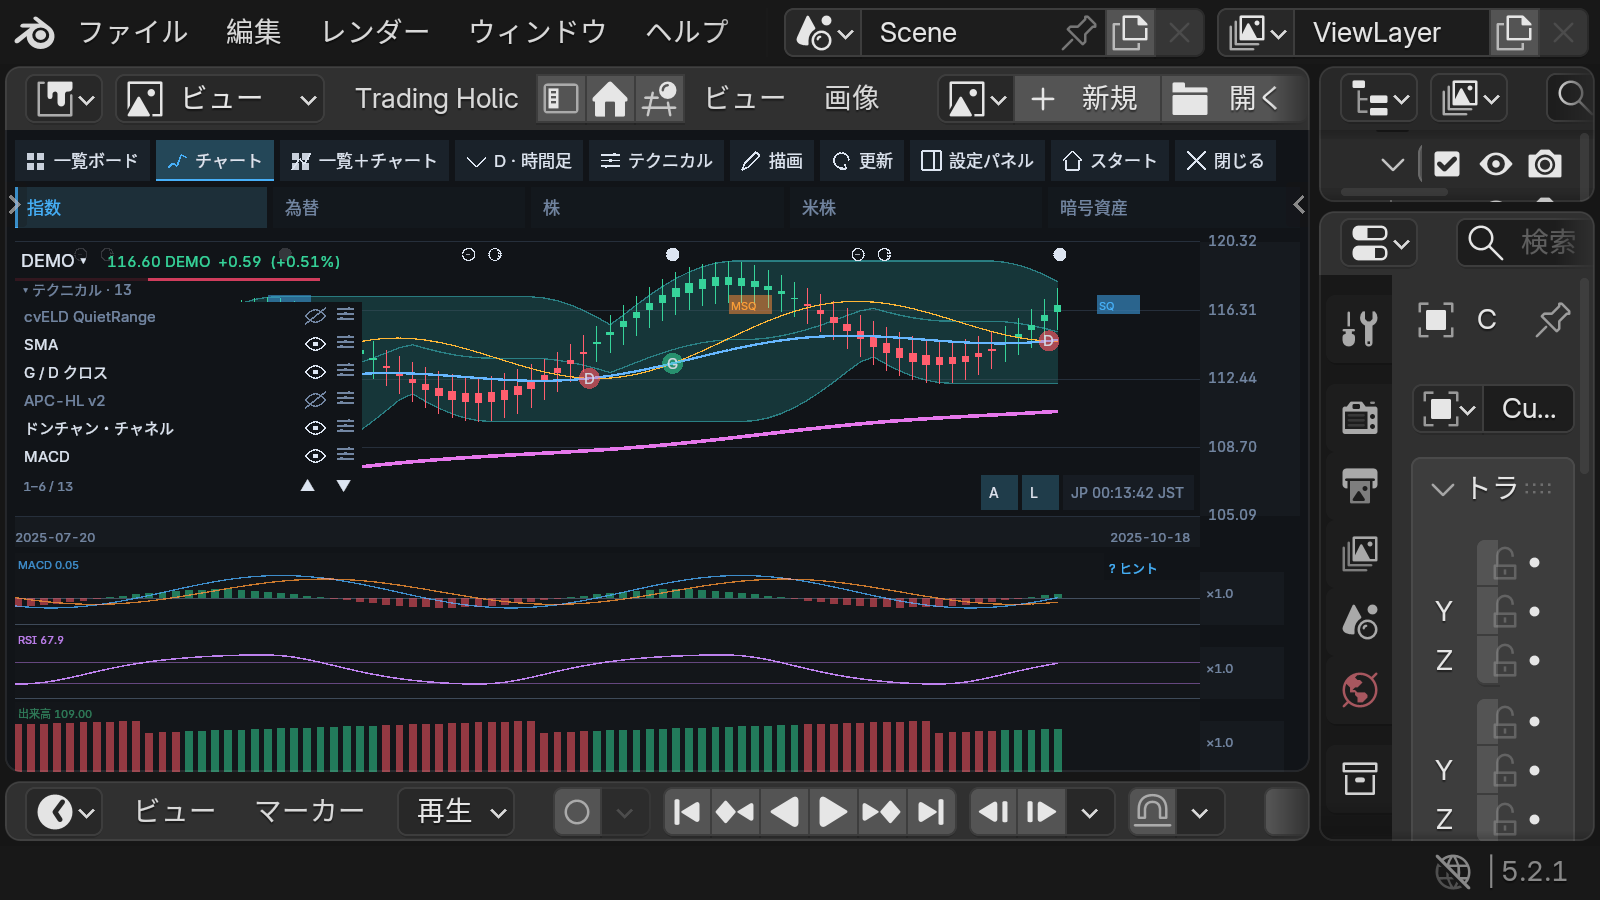
Blender 5.2.1 · Actual UI / synthetic data13
Troubleshooting and validation
Blank prices: check the symbol, timeframe and history-import result. Hover ! beside the price for errors. Old timestamps indicate cached data. Registering a code or clicking Update does not supply fresh stock prices.
Small text: adjust Font size offset from −4 to +24, hide unnecessary studies and adjust rows/opacity. If switching timeframes empties the chart, import that timeframe's history.
Compatibility validation targets Blender 4.5.8 LTS registration/unregistration/re-registration, the extension ZIP and actual GPU drawing, plus package registration and drawing on 5.2.1. This does not establish every physical input combination or every OS. Captures use an isolated scene and invented data, preserving the user's working scene.
14
License and included materials
Code is GPL-3.0-or-later. See LICENSE, SOURCE_NOTICES and LICENSE_AUDIT. Market-data rights are separate from the code license. No affiliation or endorsement by Blender, TradingView, brokers or exchanges is claimed.
Version 1.14.0 adds Blender 4.5 LTS support, current documentation, five promotional images and a tutorial. It retains 1.13.2 compact layout, 1.13.1 background-color correction and 1.13.0 JSON exchange/data restrictions. Historical descriptions of collection features do not describe the current release.
60-second overview
English narration. A 60-second overview using new artwork and user-provided screenshots.