Trading Holic in 60 seconds
English narration. Product artwork and user-provided captures.
CHARTS ALONGSIDE YOUR CREATIVE WORKFLOW
Keep an eye on your charts. Stay in your scene.
Trading Holic adds a watchlist board, technical charts and read-only backgrounds to Blender. Arrange independent panes around your work and inspect price history without leaving your workspace.
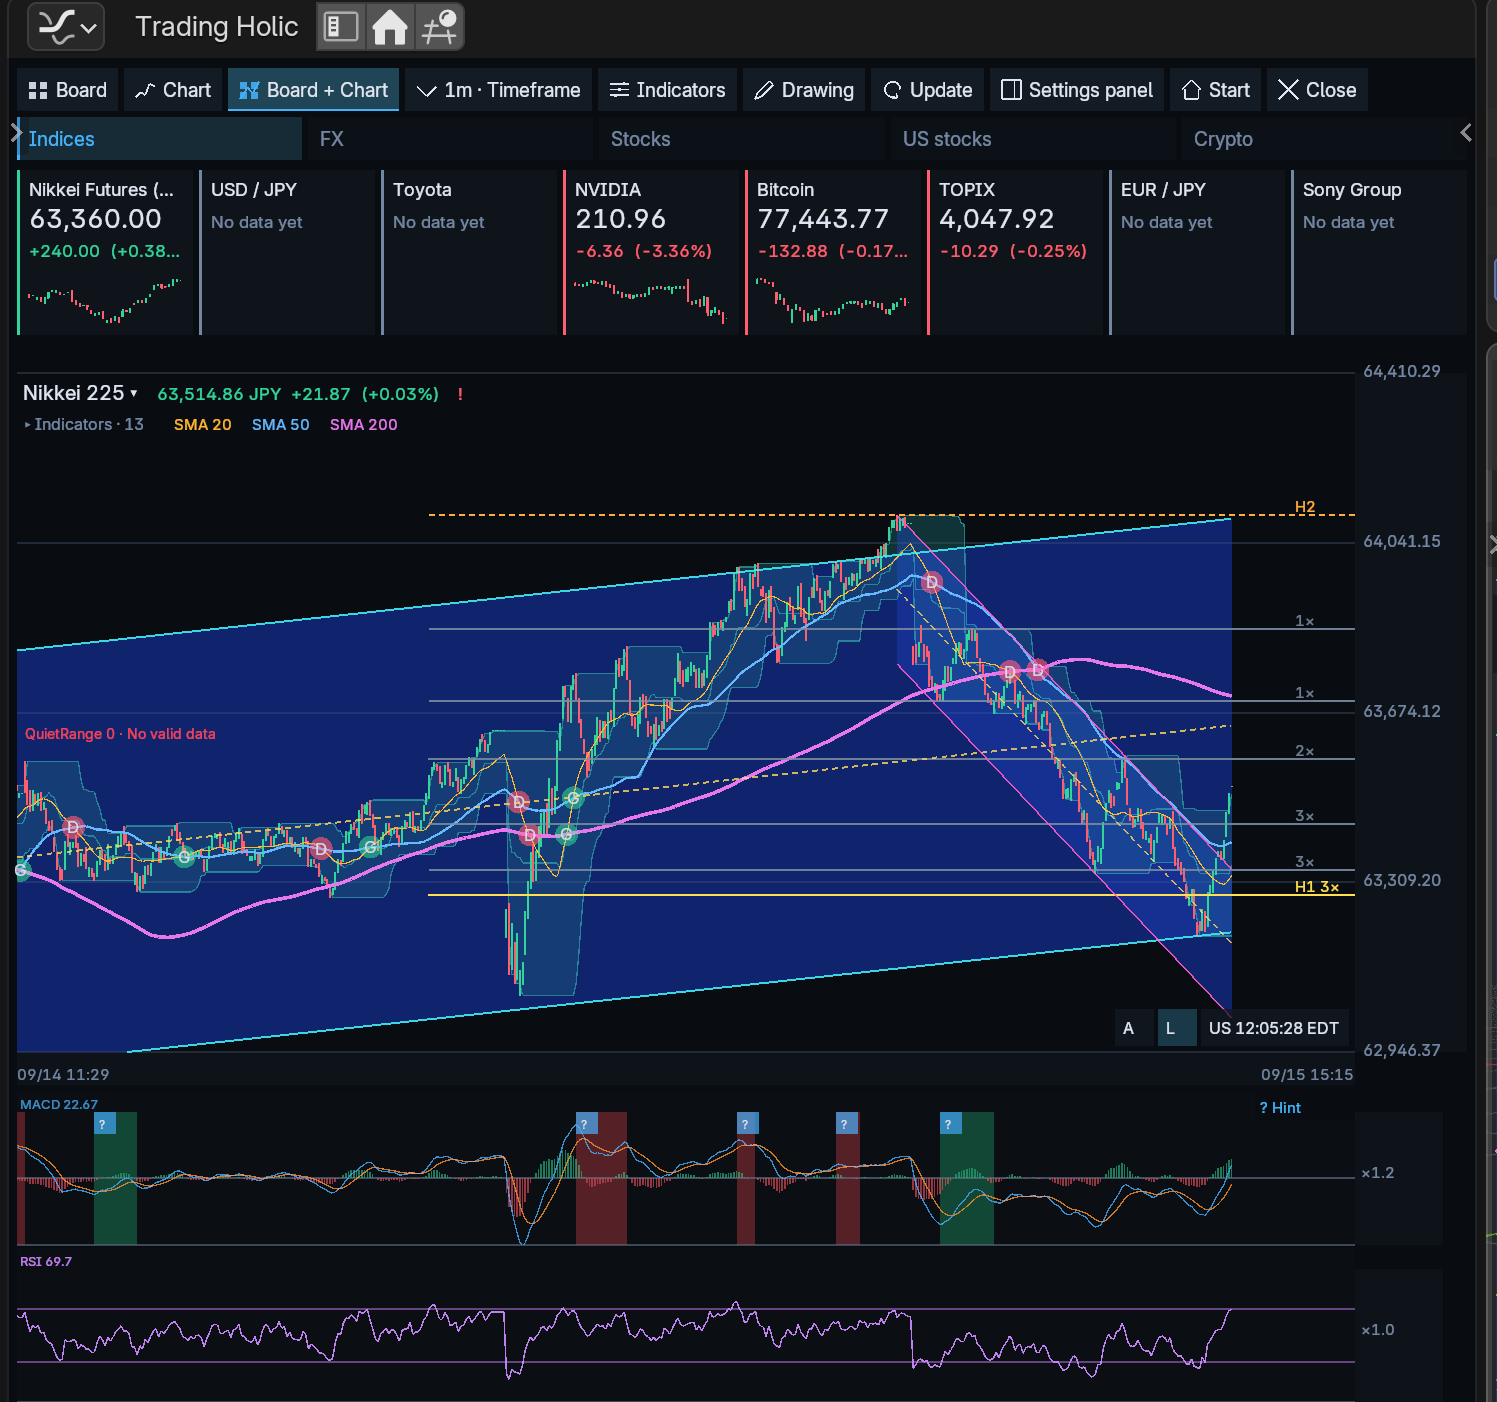
User-provided screenshot. Prices, missing data and warnings reflect the captured state.
Choose the view that fits your work
- Board: compare symbols across five watchlist groups.
- Chart: focus on one symbol with independent time and price scaling.
- Board + Chart: select a card and update the chart in the same pane.
- Background: place up to four read-only charts behind a modeling view.
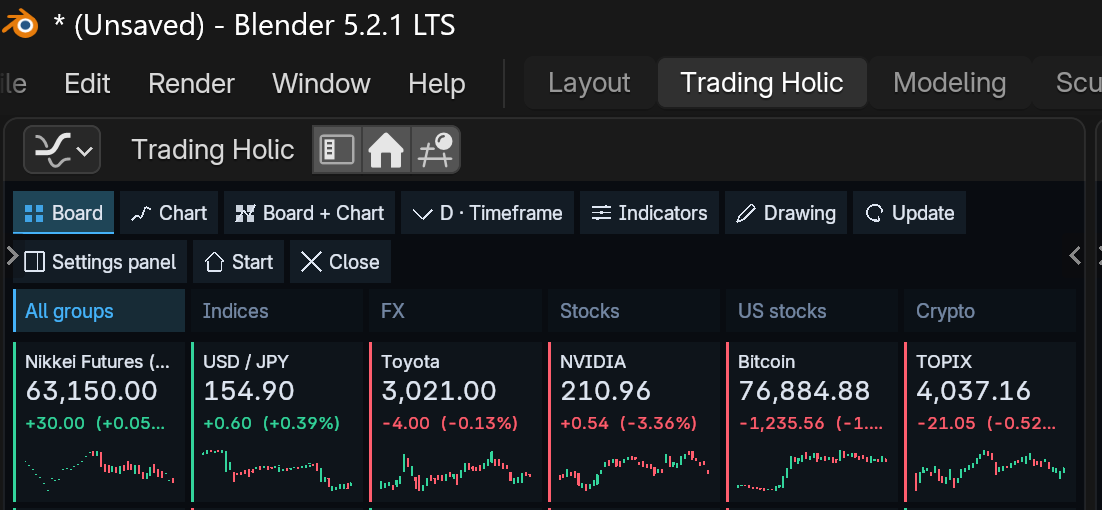
User-provided screenshot. Prices, missing data and warnings reflect the captured state.
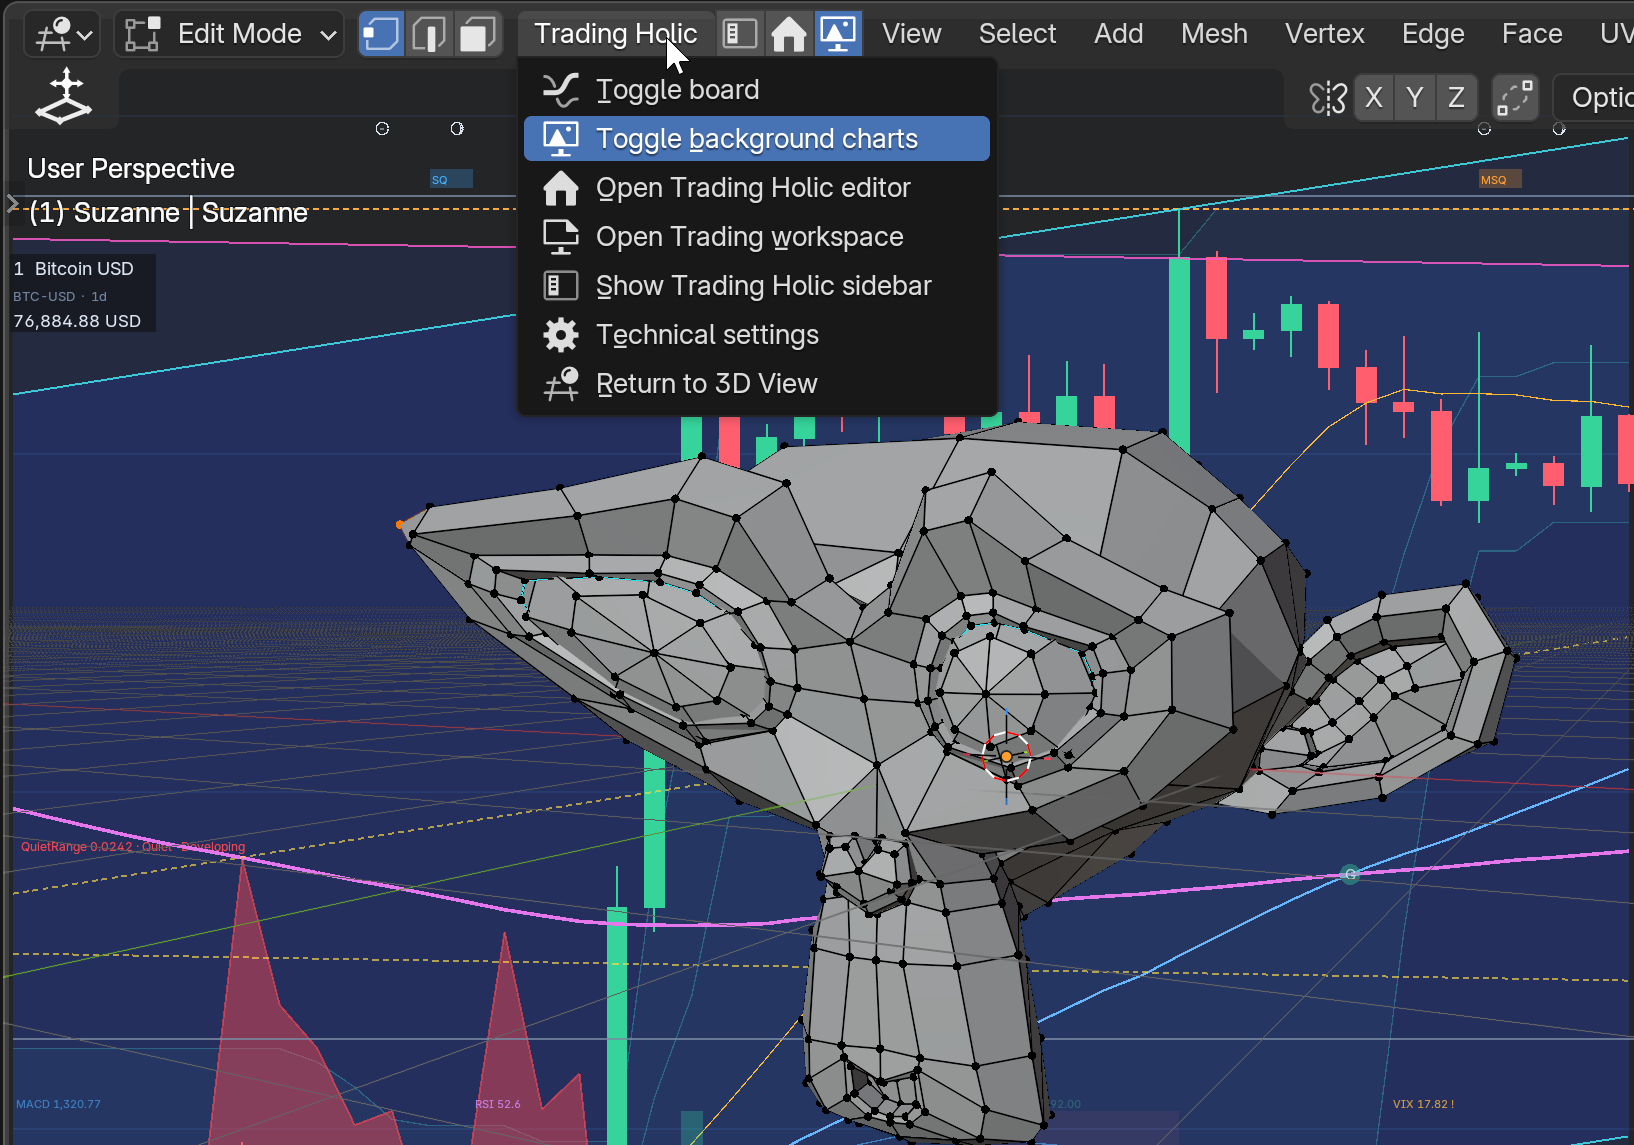
User-provided screenshot. Prices, missing data and warnings reflect the captured state.
Explore price, momentum and your own notes
SMA and crossover hints, MACD divergence, RSI, volume, Donchian or Bollinger bands, APC-HL channels and cvELD QuietRange. Expand the indicator list to show, hide or configure studies. Overlay oscillators or give them separate rows.
Draw horizontal lines, trend lines, parallel channels or freehand notes anchored to time and price. Undo chart ink with Ctrl+Z. Optional alerts check sampled prices when data is refreshed.
New in 1.15: use your language
English, Japanese, Chinese (Simplified and Traditional), Korean, Spanish, German, French and Brazilian Portuguese. Panels, charts and backgrounds follow Blender’s interface language. The editable translation CSV is included.
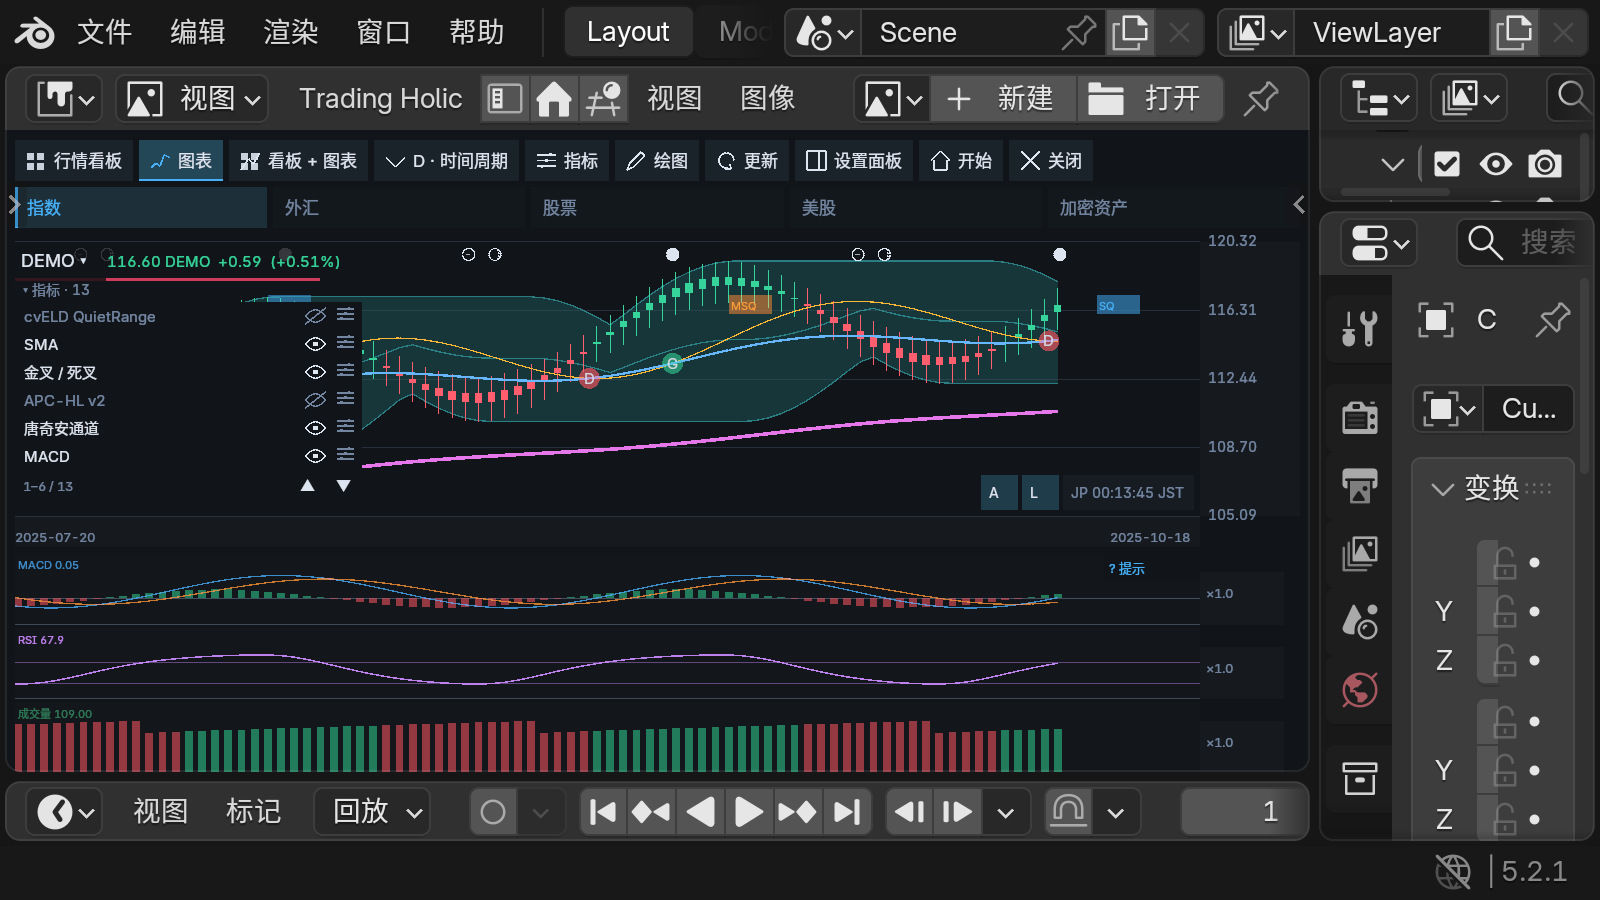
Actual Blender UI. Demonstration prices are synthetic.
Requirements and data
Blender 4.5 LTS or 5.x. Bring price-history JSON that you have permission to use. No extra Python libraries or API keys are required for local histories.
This is a visualization tool, not a broker connection or order-entry system. Live stock-price feeds, Yahoo collection, automatic Rakuten rankings, full exchange-directory downloads and embedded news headlines are not included. Only attributed Alternative.me Fear & Greed has an enabled online feed.
Your first chart
- Install the ZIP using Preferences → Get Extensions → Install from Disk, then enable the add-on.
- Open Trading Holic from the editor selector or 3D View header.
- Use Edit watchlist → Import JSON for examples/watchlist.json.
- Import examples/synthetic_history.json with Import price history JSON, then select DEMO.
- Drag to pan, use the wheel for the visible period, and drag the right or bottom axes to scale. A fits the chart; L toggles logarithmic scaling.
Adding a symbol does not fetch a price history. If no chart appears, import history for that symbol and timeframe. Close or Esc returns to the previous editor. Each pane retains its own settings.
Documentation and license
Read the complete English / Japanese user guide.
GPL-3.0-or-later, without warranty. Market-data rights apply separately. No affiliation or endorsement by Blender, TradingView, brokers or exchanges is claimed.
1.15.0: multilingual UI. 1.14.0: Blender 4.5 support and tutorial. 1.13: compact layout, background color correction and JSON exchange.